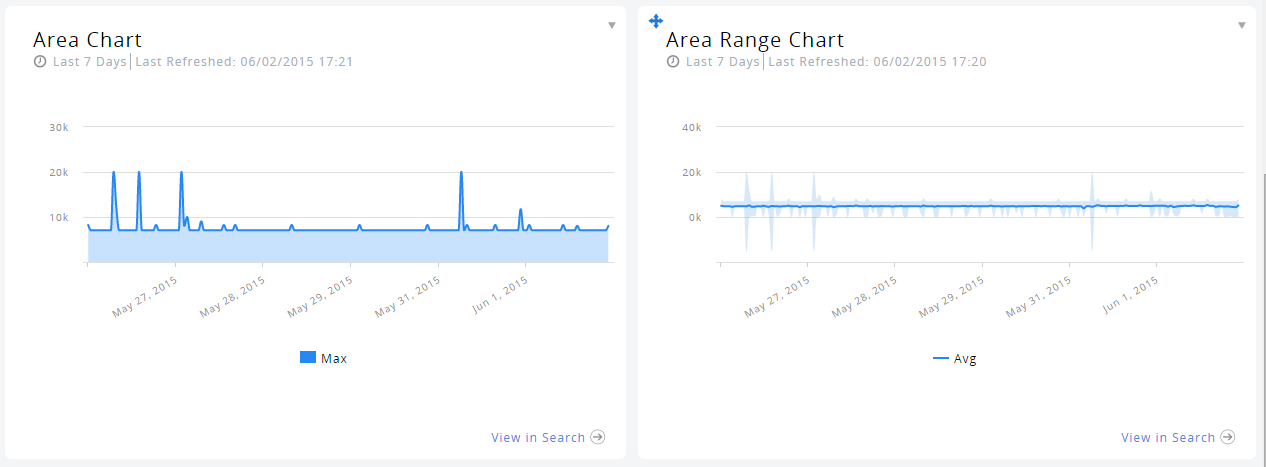
Displays an area chart showing a count over time or label of log events matching a given simple/complex Search query; gadget has a View in Search link that can be clicked to navigate to the Search Console to perform a drill-down.
To add an Area Chart Gadget:
- In Title, type a name for the gadget.
- In Search Query, type the search query to run, based on the Search simple/complex search syntax.
- In Time Range, select the time frame following which the gadget display is to be refreshed.
- In X-Axis, select the type of X-Axis to be displayed: Time or Label.
- In Group By, select the grouping dimension of the result: None, Log, Application, or Server.
- If available, click on More Settings in order to specify specific visualization options for this gadget.
- Click the Save button.
The gadget is saved in the dashboard.
Results Examples:

