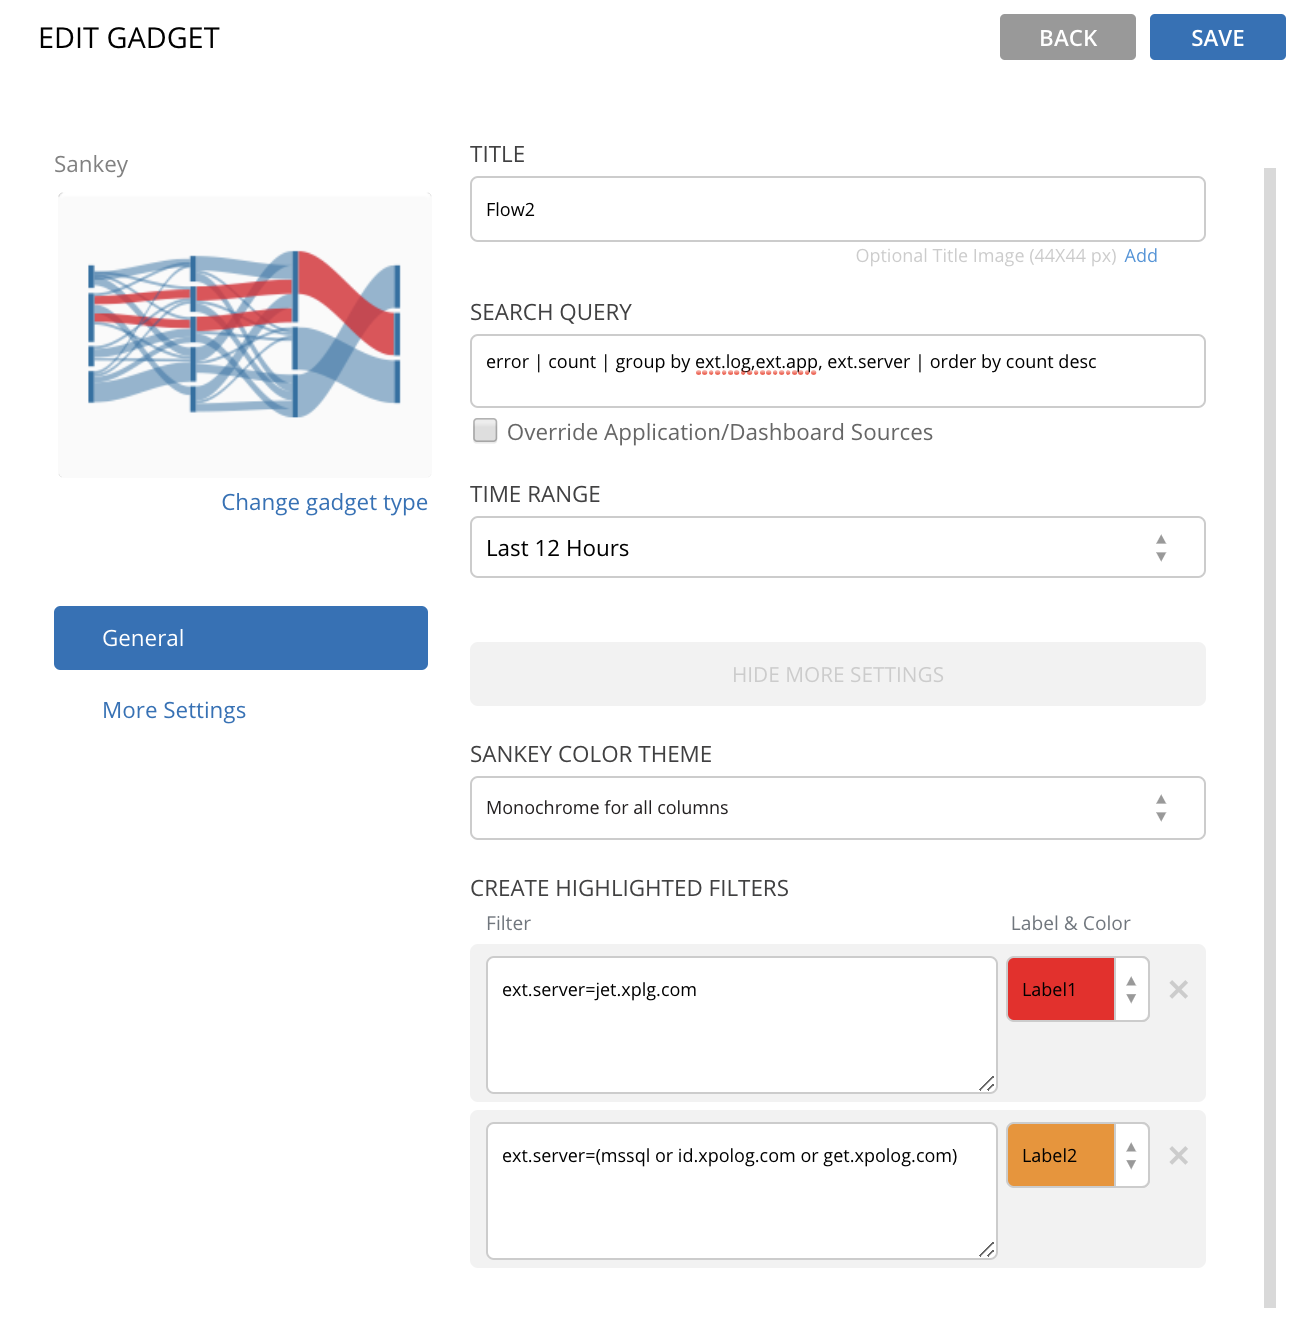
The Sankey diagram is a flow diagram in which the width of the arrows is proportional to the flow rate. It displays a flow of events with a visual representation of their movement and number of occurrences.
The search query behind a Sankey is a complex search which uses a simple count/group by objects.
To add a Sankey Gadgetwidget:
- In Title, type a name for the gadgetwidget.
- In Search Query, enter a search query that uses count and group by. Ensure the result returns a combination of up to 5 'grouped by' items and their count - you may test your search in the search console prior to defining the Sankey.
- In Time Range, select the time frame following which the gadget widget display is to be refreshed.
- More Settings:
- SANKEY COLOR THEME
- Monochrome for all columns - displays a view where all the columns are coloured the same (across the items flow).
- Use separate color per column - displays a view where each column is coloured differently.
CREATE HIGHLIGHTED FILTERS
A filter based on a search that helps highlighting specific items/flows - numbers thresholds, specific values, etc.
- SANKEY COLOR THEME
- Click the Save button.
The gadget widget is saved in the dashboard.
Example: errors in an environment - the following Sankey shows number of errors found in logs in a flow diagram: SOURCE LOG >> APPTAG >> SOURCE SERVER (using the query: error | count | group by ext.log,ext.app, ext.server | order by count desc) where specific flows are highlighted in red and others in orange
Example: Errors flow in an environment - the following sankey shows Sankey shows top errors found in logs (identified by XpoLog Analytics) in a flow diagram: ERROR >> RISK LEVEL >> SOURCE LOG >> SOURCE SERVER (using the query: * | analytics | group by Ext.log, Ext.server | display only analytics name , analytics risk in query format ("1 or 2 or 3","LOW RISK","4 or 5 or 6","MEDIUM RISK","7 or 8 or 9 or 10","HIGH RISK"), Ext.log as Log, Ext.server as Server, count | where analytics name != NULL | order by count desc)
...
Example: IP flow in access log - the following sankey shows Sankey shows top 50 IP addresses flow: IP >> VISITED URL >> HTTP STATUS CODE (using the query: IP != NULL AND URL != NULL AND STATUS_CODE != NULL in log.access | count | group by IP, URL, STATUS _CODE | order by count desc | first 50)


