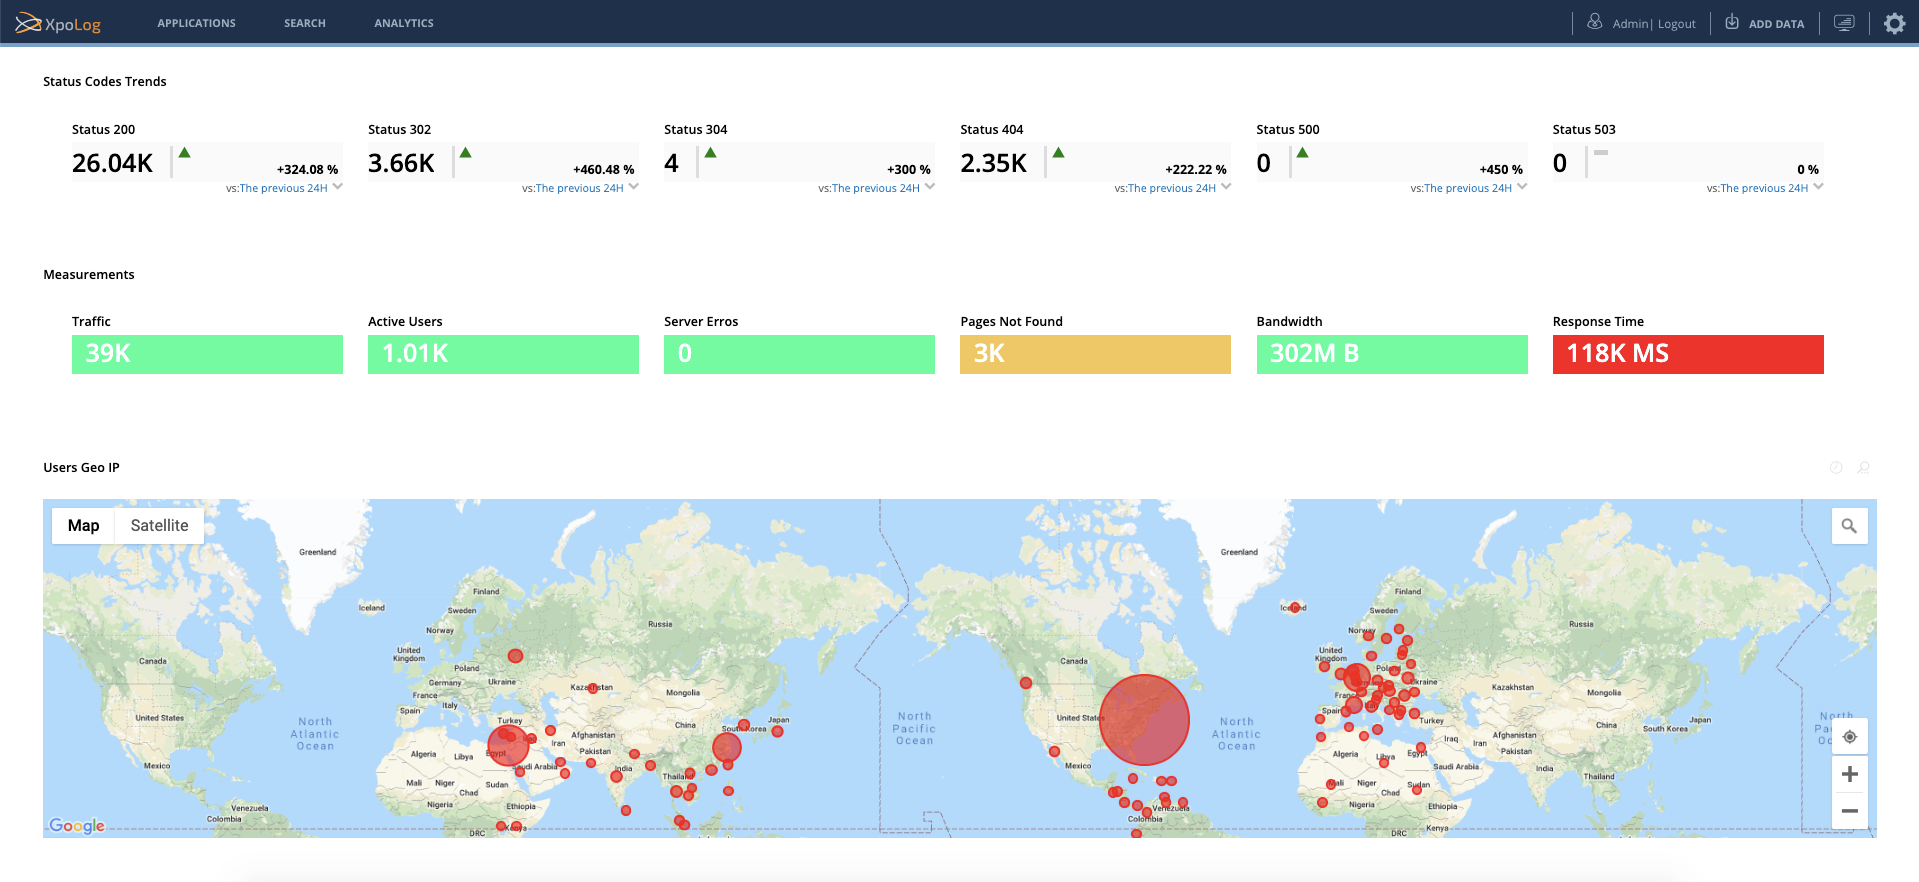
Gadgets Widgets are the data visualization units which are displayed in dashboards.
Multiple gadgets widgets can be added to a single dashboard to visualize data in many forms and shapes such as line chart, area chart, bar chart, column chart, pie chart, events list or table, analytics summary, transactions list and more.
Under this wiki section you'll find details about all gadget widgets types that are available.
View Example:
Adding a gadget widget is done from within a dashboard. After clicking a dashboard to load it, select the 'Add GadgetWidget' from the ![]() icon on the top right hand side of the Dashboard toolbar.
icon on the top right hand side of the Dashboard toolbar.
The Add a Gadget Widget administration console opens:
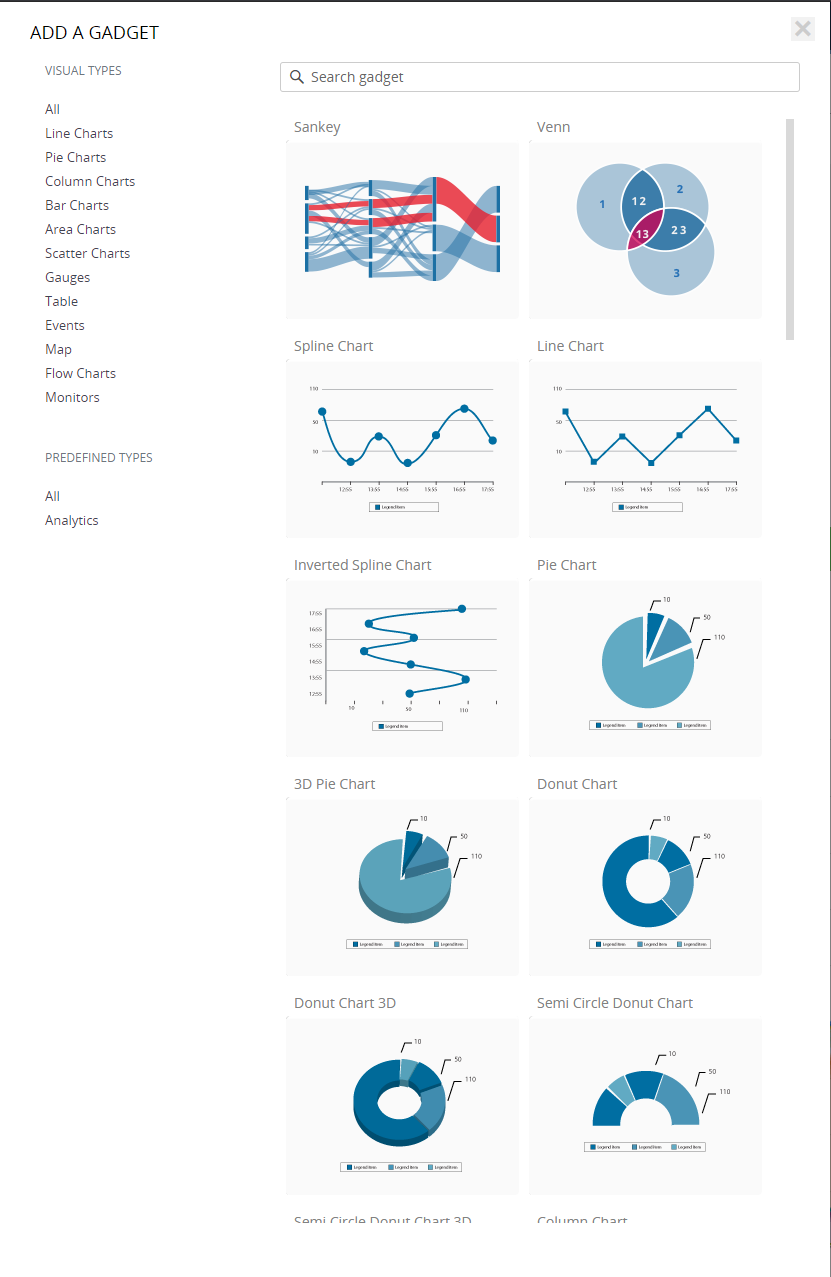
Click one of the Visual Types to filter the list of available gadgets Widgets to that specific type or type the name in the search box  to filter the list.
By clicking the image of the selected type, the gadgetwidget's administration screen will appear for defining the gadgetwidget.
To add a
...
Widget to a dashboard:
Create a dashboard or load an existing dashboard to which you want to add a gadgetWidget, and select the 'Add GadgetWidget' from the
 icon on the top right hand side of the Dashboard toolbar.
The Select Gadget Widget page opens, displaying the available gadget widget types.Click a gadget widget type.
A page opens for defining the information for the new gadgetWidget. Fill in the fields of the selected gadget widget type:
For a Line Chart gadget widget, see Adding a Line Chart GadgetWidget
For an Area gadgetwidget, see Adding an Area GadgetWidget
For a Column Chart gadgetwidget, see Adding a Column Chart GadgetWidget
For a Bar Chart gadgetwidget, see Adding a Bar Chart GadgetWidget
For a Stacked Grouped Column gadget widget, see Adding a Stacked Grouped Column Chart Widget
For a Pie Chart gadget widget, see Adding a Pie Chart GadgetWidget
For a Scatter gadgetwidget, see Adding a Scatter Chart GadgetWidget
- For a Gauges gadget widget, see Adding a Gauge GadgetWidget
For a Table gadgetwidget, see Adding a Search Results Summary GadgetWidget
For an Events gadgetwidget, see Adding a Static Events List GadgetWidget
For a Map gadgetwidget, see Adding a Map GadgetWidget
For a Google Map gadgetwidget, see Adding a Map GadgetWidget
For a Transactions gadgetwidget, see Adding a Transactions GadgetWidget
For an Analytics gadgetwidget, see Adding an Analytics GadgetWidget
For a Container gadgetwidget, see Adding a Container GadgetWidget
For a Monitors gadgetwidget, see Adding a Monitors GadgetWidget
For a Monitors Alerts gadgetwidget, see Adding a Monitors Alerts GadgetWidget
For a Sankey Diagram gadgetwidget, see Adding a Sankey Diagram GadgetWidget
For a Venn Diagram gadgetwidget, see Adding a Venn Diagram GadgetWidget
For a Summary gadgetwidget, see Adding a Search Results Table GadgetWidget