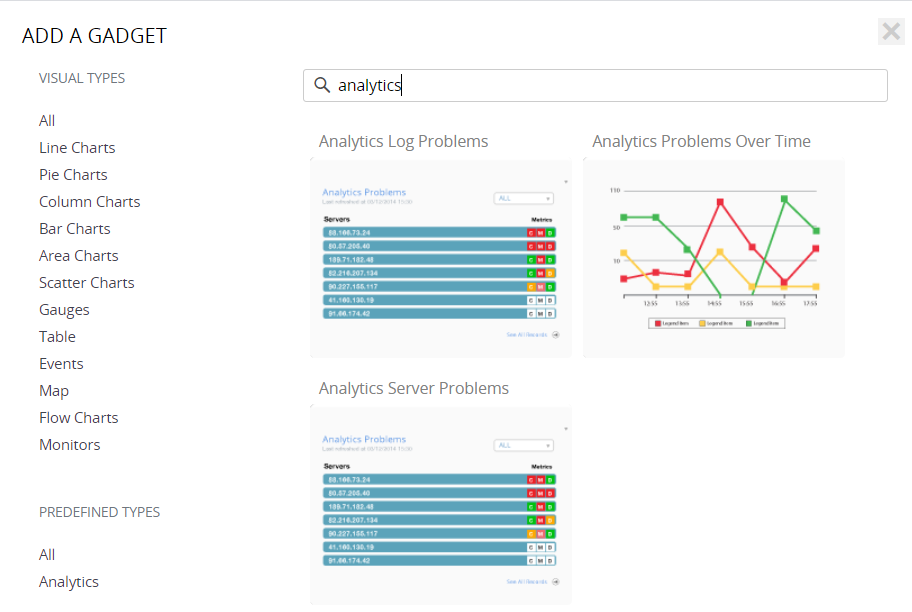
Displays log top problems and server problems detected by Analytics; gadget widget has a View in Analytics link that can be clicked to navigate to the Analytics Console to perform a drill-down.
To add an Analytics
...
widget:
- Select the type of chart to be displayed: Analytics log problems or Analytics problems over time or Analytics server problems.
- In Title, type a name for the gadgetwidget.
- In Time Range, select the time frame following which the gadget widget display is to be refreshed.
- Specify the Data Sources to be included in the Analytics view (server/folder/application/logs).
- Click the Save button.
The gadget widget is saved in the dashboard.
...