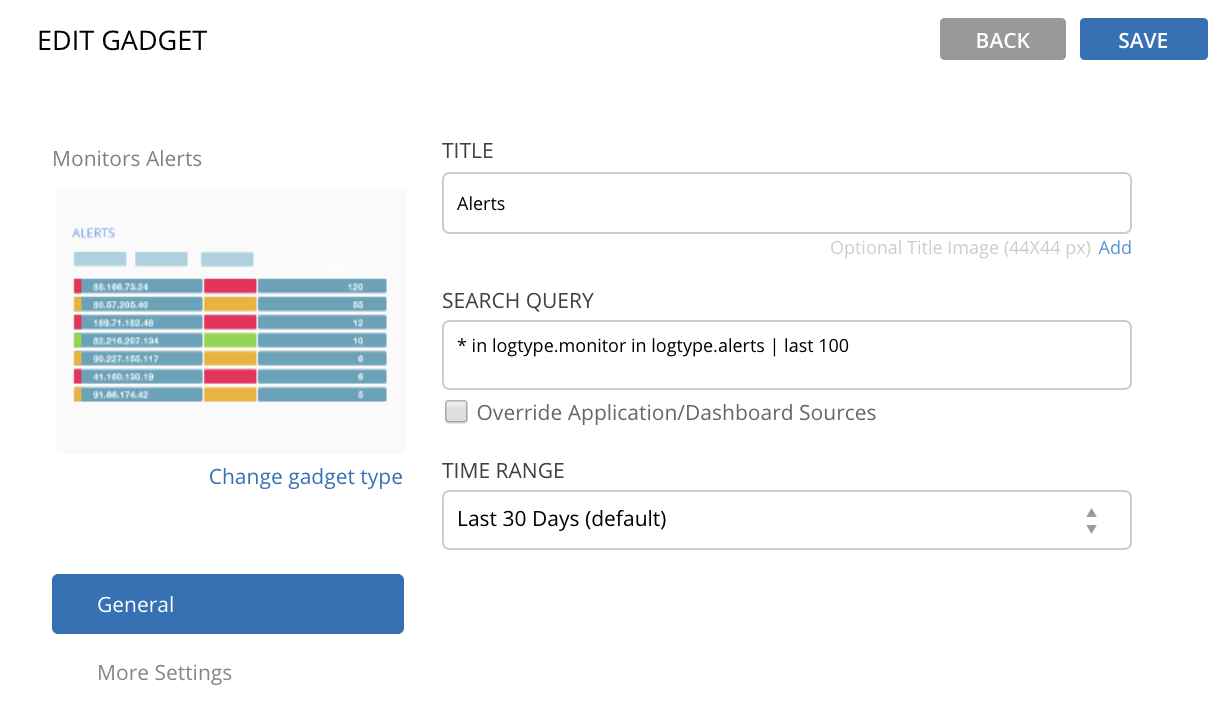
Displays all alerts triggered by monitors in the system (activating monitor's executions logging is required) as a chart showing the details of each alert, behavior over time and associated events.
To add a Monitors Alerts Gadget:
- In Title, type a name for the gadget.
- In Search Query, type the following search query:
* in logtype.monitor in logtype.alerts | last 100 - In Time Range, select the time frame following which the gadget display is to be refreshed.
- Click the Save button.
The gadget is saved in the dashboard.

