com.atlassian.confluence.content.render.xhtml.migration.exceptions.UnknownMacroMigrationException: The macro 'html' is unknown.

Search User Interface Elements

 XpoLog Search is equipped with a user friendly graphic user interface (GUI), which provides a complete set of tools to search for event data that meets specific criteria.

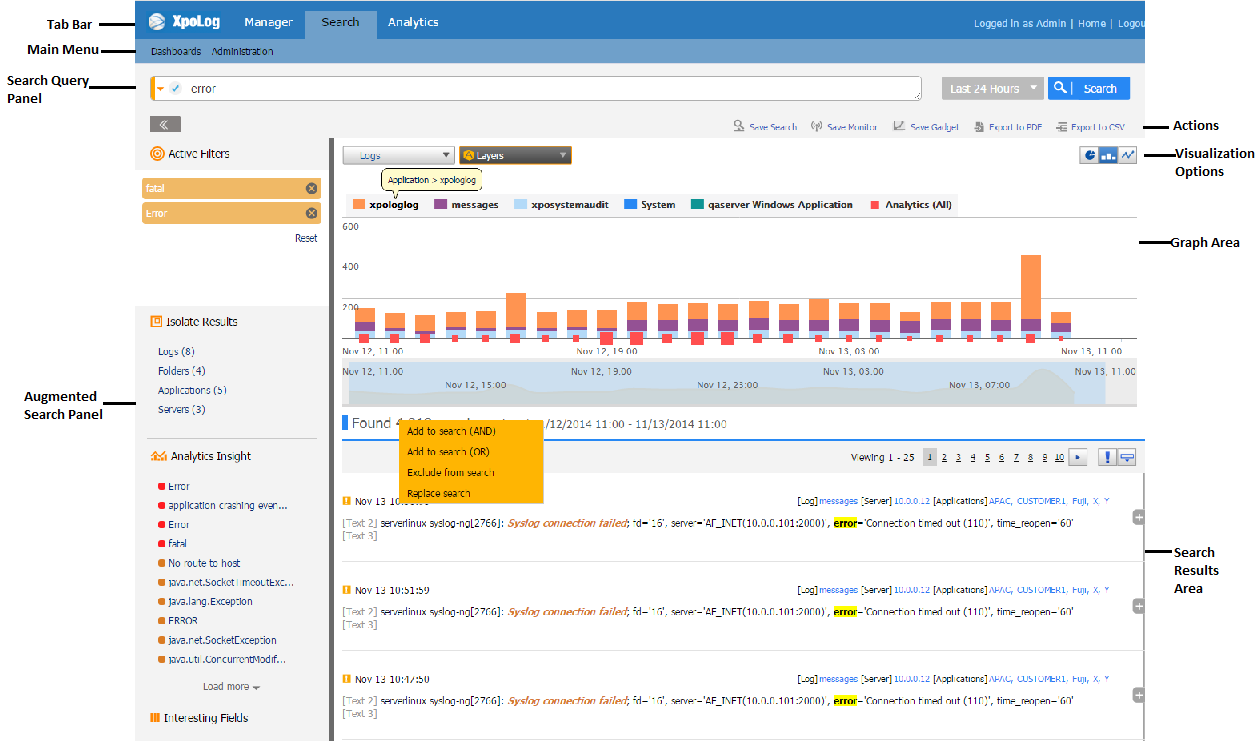
The Search user interface includes the following main elements:


ElementDescription
Tab BarTabs for accessing the XpoLog, Search, and Analytics applications.
Main Menu

Includes menu items and submenus for performing actions in the XpoLog applications. Available menus are:

  • Dashboards
  • Administration
Search Query Panel

Area for entering the search query and the time interval for running the query. 

In addition, this panel includes the following feature:

  • Open the search options window button – Clicking this menu opens a window with links to four windows: Search History, Saved Searches, Simple Search Syntax, and Complex Search Syntax.
Graph Area

Displays two graphs:

  • Main graph – a graphic distribution of the events resulting from the search query over time.
  • The x-axis presents indications on the errors detected by XpoLog Analytics engine based on severity and number of occurrences (red=high, orange=medium, yellow=low / the size of the icon represents the relative number of occurrences in that time period compared to other periods)
  • Zoom-in graph – shows zoom-in area with respect to original search context.

    In addition, this panel includes the following feature:


    • Actions Items – you can perform the following actions: Save Search, Save Monitor, Save Gadget, and Export to PDF/CSV. 
    • Visualization Buttons – Clicking these buttons presents the search results in different way - line (aggregated/split per source), bar (aggregated/split) and pie charts.
Augmented Search Pane

Enables refining your simple search results. Includes the following sections:

  • Active Filters - active filters are stored and may be removed to return to a previous view.
  • Isolate Results - select source(s) in order to isolate results based on log/folder/application/server.
  • Analytics Insight - a list that centralizes all the Analytics results related to the current search results. Click a suggestion to see where it appears over time and to add it to the search query.
  • Interesting Fields - a list of logs columns which different complex functions are available on. Click a column name to see which functions may be activated on it.
Search Results Area

In the case of a simple search, displays all the events that match the search query.

In the case of a complex search, displays a summary table of the events that match the search query.

Mouse Over Events in the search results area presents 2 options on the highlighted phrase:

  • Search Actions - add/exclude/replace the phrase from the current search.
  • Data Markers - pick a color to paint the highlighted phrase across all results.