Analytics User Interface
- Omry Koschitzky
Analytics is equipped with a user friendly graphic user interface (GUI), which provides a complete set of tools to analyze detected problems.
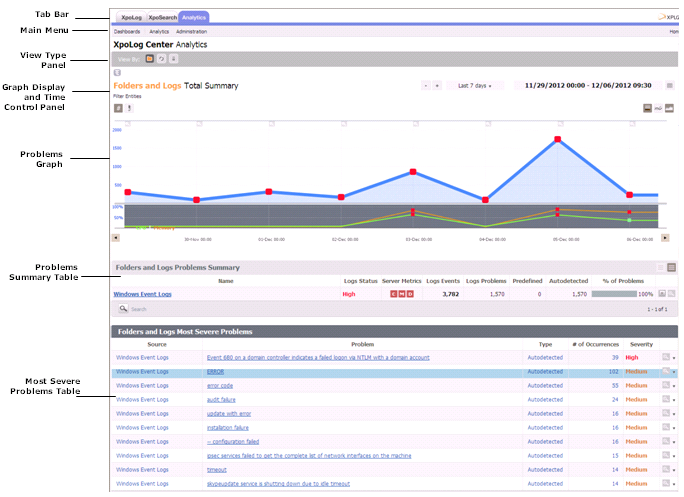
The Analytics user interface includes the following main elements:
| Element | Description |
|---|---|
| Tab Bar | On the left side, XpoLog, XpoSearch, and Analytics tabs. On the right side, an XPLG icon. For details, see Tab Bar. |
| Main Menu | On the left side, includes the following menu items and submenus for performing actions in Analytics.
On the right side, has a Home button for navigating to the XpoLog homepage, and in organizations where security is activated, also displays the Username and a Logout button. |
| View Type Panel | Provides three buttons for selecting the graph view type: Folders and Logs, Applications view, or Servers view. See |
| Graph Display and Time Control Panel | The graph display area enables filtering the graph to show analysis for logs under specific Folders, Applications, or Servers. It also provides buttons for zooming into or out of the graph, viewing the default view, and has a toolbar with buttons for hiding metrics, summary view, split view, risk view, and total view. The time control area enables users to select the time frame for which the Analytics analysis is presented; this time frame can be changed easily at any point. |
| Problems Graph | Displays a graphic distribution of the analysis. |
| Problems Summary Table | Presents detailed information of the data displayed in the problems graph. For each member in the Folders and Logs, Application, or Server (according to what you selected), a summary of the analysis is displayed, each relevant to the specified time frame. |
| Most Severe Problems Table | For each selected view type and time frame, the Analytics presents the top 10 problems (with the highest severity) that were found in the analysis. |